After two centuries – a note on the Thomas Young's merits in wave optics
Vukota M. Babović · 2003
AFTER TWO CENTURIES — A NOTE ON THE
THOMAS YOUNG’S MERITS IN WAVE OPTICS
Vukota M. Babović
University of Kragujevac — Faculty of Science, Department of Physics,
R. Domanovica 12, 34000 Kragujevac, Serbia & Montenegro
E-mail: babovic@verat.net
Abstract: Two centuries passed from the days when Thomas Young successfully demonstrated light interference. Now we see that his double-slit experiment has unquestionable historical glory. All relevant textbooks over the world use Young’s scheme in explaining basic light interference principles. We propose a suitable graphical interpretation of the Young’s interference formula and briefly report on a corresponding teaching tool.
1. Physical experiments which once ago were major scientific events are now unavoidable chapters in contemporary textbooks. This is a way how knowledge grows, and a way how the significant part of pedagogical and didactical material appears. A good example is the famous double-slit optical interference experiment. In the beginning of the nineteen century Thomas Young first offered a convincing experimental basis of the wave theory of light showing that two overlapping lights fields can interfere with each other. On the bicentenary of Young’s results1 we can state that these are present in all relevant university courses on light waves (Born & Wolf 1964, Serway 1998). Although the subsequent development of physics and technology in a long period of time offers many other interference schemes easy to perform and convenient to measure and teach, the pioneering Young’s method has the attractiveness of a direct and obvious insight into wave figures of light. One could enumerate several important points inspiring authors to include the double-slit idea in textbooks; we recognize these as: a) transparency of procedure, b) simple wavelength formula, c) historical priority, and d) natural access to the light coherence concept. So the Young’s experiment really could be named, two hundred years after, as a historical one.
There is another significant concept due to Thomas Young. As we see, this concept has also survived the passing of centuries. In the year 1802 he formulated the idea of a diffraction pattern buildup process, according to which the observed wave field is a superposition of a) the incident unperturbed wave and b) the edge-diffracted wave originating at the rim of the obstacle. This explanation was forgotten (if not rejected) for a long time. However, today is the Young theory not only proved as fully equivalent to Huygens-Fresnel’s physical model, but the very physical reality of edge-diffracted waves is strongly confirmed in experiments (Perkal’skis and Sotiriadi 1977, Ganci 1989).
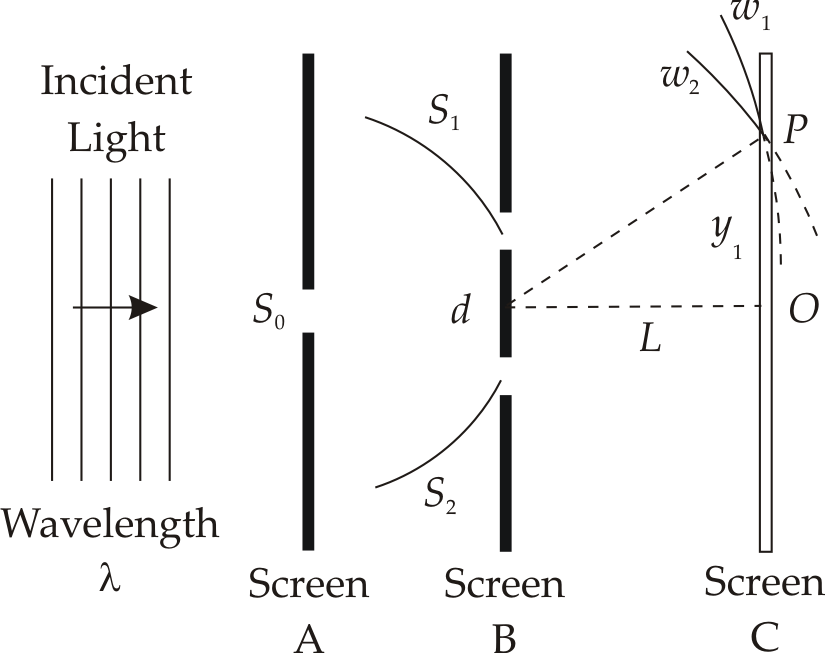
2. Shortly overviewing the Thomas Young’s interferometric idea, let us examine figure 1. Young used sunlight incident on a screen A. Passing trough a pinhole S light spreads out by diffraction towards an another screen B having two symmetrically punched pinholes S and S , situated on the same wave surface. Pinholes oscillating in phase with each other serve as two coherent punctual light sources giving two spherical overlapping waves. So he got waves which could interfere in space; an interference pattern was clearly seen on a third screen C. There were regions of maximum as well as minimum light intensity, minima being located between each pair of adjacent maxima.
In our days, the modification including long narrow slits instead of pinholes is popular in student laboratories. As a result, a more intense interference fringes appear on the screen C; observations are easer and measurements more accurate.
Let L be the distance between the screens B and C. Let d be the slit spacing. The incident light is nearly monochromatic, with the single wavelength . At the central point O we have an intersection of two analogous wave surfaces and here waves will interfere constructively producing the central maximum in the intensity of light. At point P (and at a symmetrical point below the center not shown on figure 1), a distance from O, we have an intersection of secondary wave surfaces having the difference in radii equal . Therefore at P will again take place a constructive interference giving the first lateral maximum. The separation between these maxima can be deduced from the conditions for maximum intensities
where we could insert . Now for in the small angle approximation we arrive to the important formula already crowned with historical glory
With a help of this expression Young undertook the first measurement of the average wavelength of sunlight beam spectrum. His result appeared to be only three percents over the modern value recognized as 555 nanometers (Holliday and Resnick 1988).
3. The contemporary insistence on a strict use of SI units could be inadequate in student treatment of Equation (2). Really, we see a sort of units’ conflict which is not so rare in optics. The natural unit for sunlight wavelengths of course is a micrometer. The slit separation is easily put on in tenths of a millimeter. We want the fringe separation to be sufficiently large, and a distance of nearly half of a centimeter would be nice. It means on the other hand that the slit-screen separation must be at least one meter. So we detect, in a single combination, a cooperation of various lengths differring from each other in million times. Could we ‘reconcile’ these discrepancies? We have found that Equation (2) can be, with a certain benefit, rearranged to read
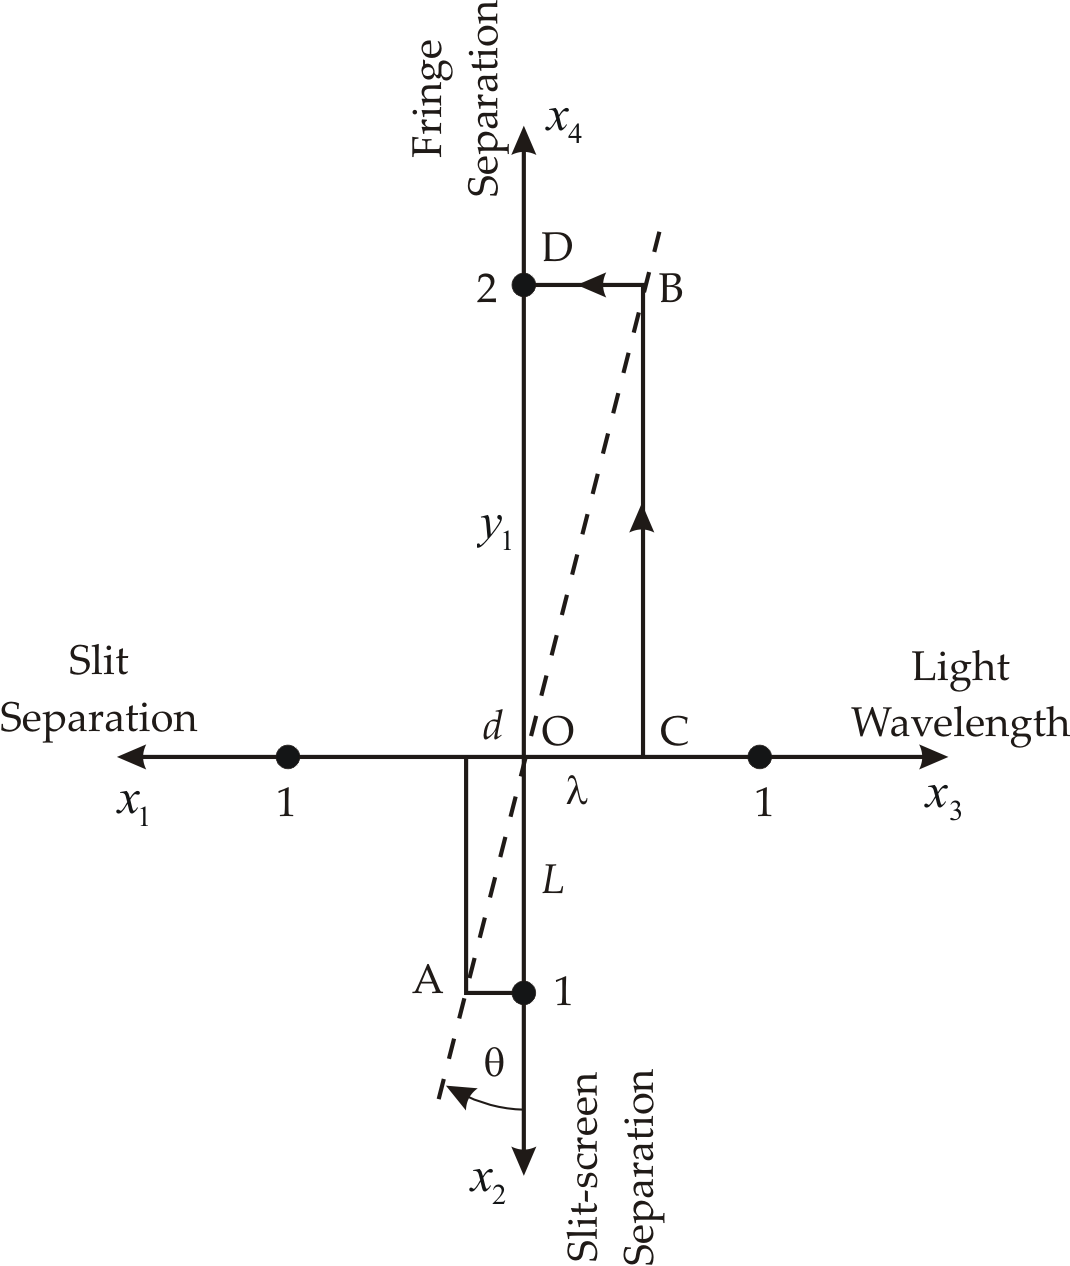
Now we see that this proportion offers an ample graphical presentation. On figure 2, four axes stretch from an origin designated with O: a) the slit separation Ox , b) the slit-screen separation Ox , c) the light wavelength Ox and d) the fringe separation Ox . The unit mark is the same for all axes. So the segment represents the slit separations in microns and the segment the split-screen separation in meters. Then these two distances give us the point A in third quadrant. The line put through the points A and O makes the angle with the half-line Ox . Now we can measure the distance in micrometers, as shown on the light wavelength axis. The vertical line from the end point C intersects the inclined line in the point B. The projection C of this point on the fringe separation axis determines the distance . This is just the value we are looking for: we have detected, by a direct graphical procedure, the place of the first light maximum on the third screen from figure 1. Actually, on figure 2 we have sketched the example in which , , with the result .
Collecting (during five last seasons) second year students’ impressions about our field of four separations, we can point out several benefits which yields the procedure. (i) The figure facilitates the organization of a double-slit experiment; it provides (in an obvious way) the relations between optic-mechanical quantities involved in the set-up structure. (ii) The figure suggests that the fringe separations could be enlarged simply by increasing the slope of the leading line (i.e. by lowering the angle ); it could be achieved by suitable combinations of distances and . (iii) Students easy realize that a blue light produces a denser fringe picture then a red light does. (iv) The case when numerical values of and cooperate to give is especially attractive; then the numerical value of simply coincides with those of the applied wavelength. (Note that the “graphical quantity” can take values of several tens of degrees without violating the small-angle assumption .)
In some textbooks (Landsberg 1976) we read an interesting story according to which in year 1655 Grimaldi failed to establish the effect of interference because the screen A carrying the pinhole S was lacking in his experimental scheme2. We believe that this episode is an important pedagogical detail: the double slit experiment in student labs requires the original arrangement which includes the point-like (or line-like) source S ; instead of sunlight one could apply a commercially available incandescent lamp - the tungsten filament and the Sun are two objects which radiate substantially according to Planck’s law (Zanetti 1984). (There are many other interference experiments based on lasers and modern technological innovations which may include more or less tricky complements.) In that way students come naturally across the problem of light coherence. For a similar reason we do not recommend the insertion of a lens behind the two slits, the screen C being in the focal plane of the lens. Thomas Young’s experiment must retain its primary chastity.
There are some other interference and diffraction formulae which can be interpreted very similarly as we have done with equation (2). For example, positions of the fringes of a diffraction grating could be found by means of the tilted line in the plane of adequate four distances. This is not surprising: the equation for fringe locations is identical with equation (1) and the generalization is rather straightforward. We stress that the graphical procedure could be practically done without the restriction to the small angles and may include higher order numbers .
Physicists all over the world use now the double-slit idea at least in three very different parts of physics, carrying out the interference with mechanical, electromagnetic and de Broglie waves. No doubt, water waves in a ripple tank, which demonstrates Huygens’s wavelets, had been an inspiration for Young to arrange a similar scheme for optical waves. As it often occurs, many authors now prefer to speak a little inversely, saying that an interference pattern on water is analogous to that observed in Young’s double-slit experiment. The popularity of Young’s scheme is sometimes applied in other interference experiments. So we can analyze the operation of the Fresnel’s two-mirror, or the Frenel’s biprism arrangements seeking but its reduction to analogous fictive two-slit case. Above all, these treatments could be recognized as factual identical; Tonomura et al 1989 challenged the two-slit experiment for electrons, once meant as purely thought one, and prevailed over the extremely small wavelength problem realizing measurements in the form of biprism interference. At the time a fiber optic realization of Young’s interferometer could be applied to measure the spatial coherence (in Anderson and Puhr 1993 version the fiber ends act as the slits).
4. In conclusion let us point out that one can fabricate a teaching aid based on the above considerations to accompany Young’s double slit interference kit in a student lab. In our variant (a sketch is presented on figure 3), this tool is realized as a transparent plastic foil placed on the drawing of four axes field. This drawing is glued on a cardboard support; the circular foil, which has a red line going through its center, can pivoted about the four separation origin and can easily match the requirements of the experiment.
Figure 3 shows the usage of the tool in the case of a monochromatic light wave incident on a diffraction grating. By rotation, the plastic cover has to be so positioned that the red line stretches from the point A(d, L) toward the origin. This line intersects the dashed line indicating the number of micrometers for the wavelength of the He-Ne laser light. So, with the grating slit spacing one could expect to see on a screen removed for the first order maximum separated for nearly from the center.
We live the days of a rapid development of computer-supported methods which could facilitate measurements and more elucidate its pedagogical aspects. If so, one could raise the argument against a classical lab tool, as a nomogram really is. But a comment we believe could be resonable reads: elementary lab measurements should be done with elementary lab tools.
References
Anderson B L, Puhr P L 1993 Twin-fiber interferometric method for measuring spatial coherence Optical Engineering 32 926-932.
Born M, Wolf E 1964 Principles of optics (Oxford: Pergamon Press)
Ganci S 1989 An experiment on the physical reality of the edge-diffracted waves Am. J. Phys. 57 370-373.
Holliday D, Resnick R 1988 Fundamentals of physics (New York: John Willy & Sons)
Landsberg G S 1976 Optics (Moscow: Nauka) (in Russian)
Overduin J M 2002 Eyesight and the solar Wien peak Am. J. Phys. 71 216-219.
Perkal’skis B Sh, Sotiriadi G N 1977 Dve demonstracii po kursu fiziki, Usp. Fiz. Nauk 121 169-170 (in Russian)
Serway R A 1998 Principles of Physics (New York: Saunders)
Tonomura A, Endo J, Matsuda T and Kawasaki T 1989 Demonstration of single-electron buildup of an interference pattern Am. J. Phys. 57 117-120.
Young T 1802 On the Theory of Light and Colours, Philos. Trans. R. Soc. London 20 12-48.
Zanetti V 1984 Sun and lamps Am. J. Phys. 52 1127-1130.
Babovic, Figure 1
Babovic, Figure 2
Babovic, Figure 3
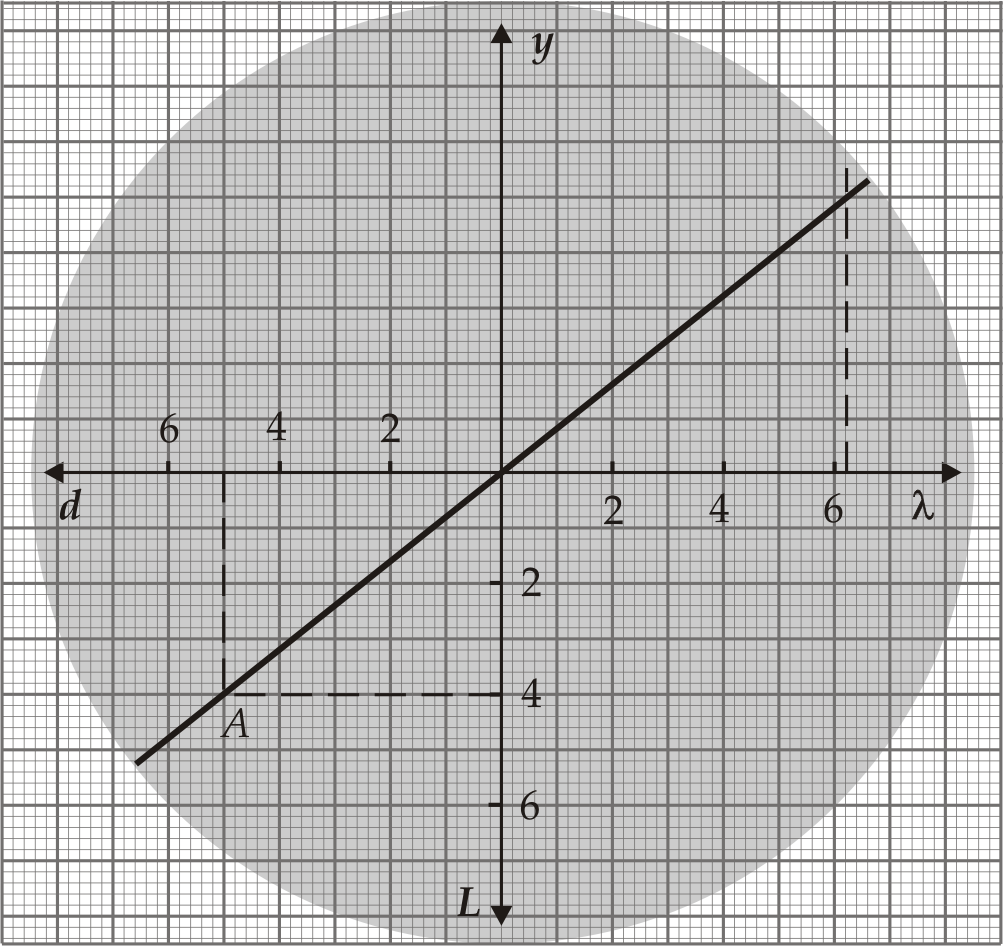
Figure captions
Figure 1 Crucial objects in a double-slit interference experiment. Incident (incoherent) light illuminates screen A. Light diffracted from pinhole S reaches screen B and induces secondary point light sources S and S laying on the same wave surface . Coherent spherical light waves interfere in the volume right from B and make an interference pattern on screen C. Point O is the locus of the main light maximum. Wave surfaces and have path difference equal to the light wavelength . The intersection of and in vertical plane is at P; distance is the radius of the first circular interference fringe. Note the symmetrical point below the center O is omitted.
Figure 2 Space of four separations suitable for processing of a double-slit interference experiment. Angle is deduced from chosen distances d and L. Doted line then serves in determining fringe separation starting from selected sort of light, i.e. the given wavelength. Tick marks for all axes are the same. Slit separation d in millimeters, as well as fringe separation ; slit-screen separation L in meters, whereas light wavelength in microns.
Figure 3 Young’s nomogram. The point is the working point depending on (slit separation) and (screen separation). The straight line running through both the working point and the origin intersects the vertical dashed line representing the used wavelength of light. The height of the intersection point gives the first order maximum location.
Footnotes
-
Some authors quote, as Halliday and Resnick do, the year 1801 as the date of Young’s discovery; yet we also read, for example in Landsberg’s optics, the year 1802 for the adequate datum. As a rule, authors from East Europe use this last fact as relevant information. ↩
-
Angular dimensions of light source must satisfy the inequality
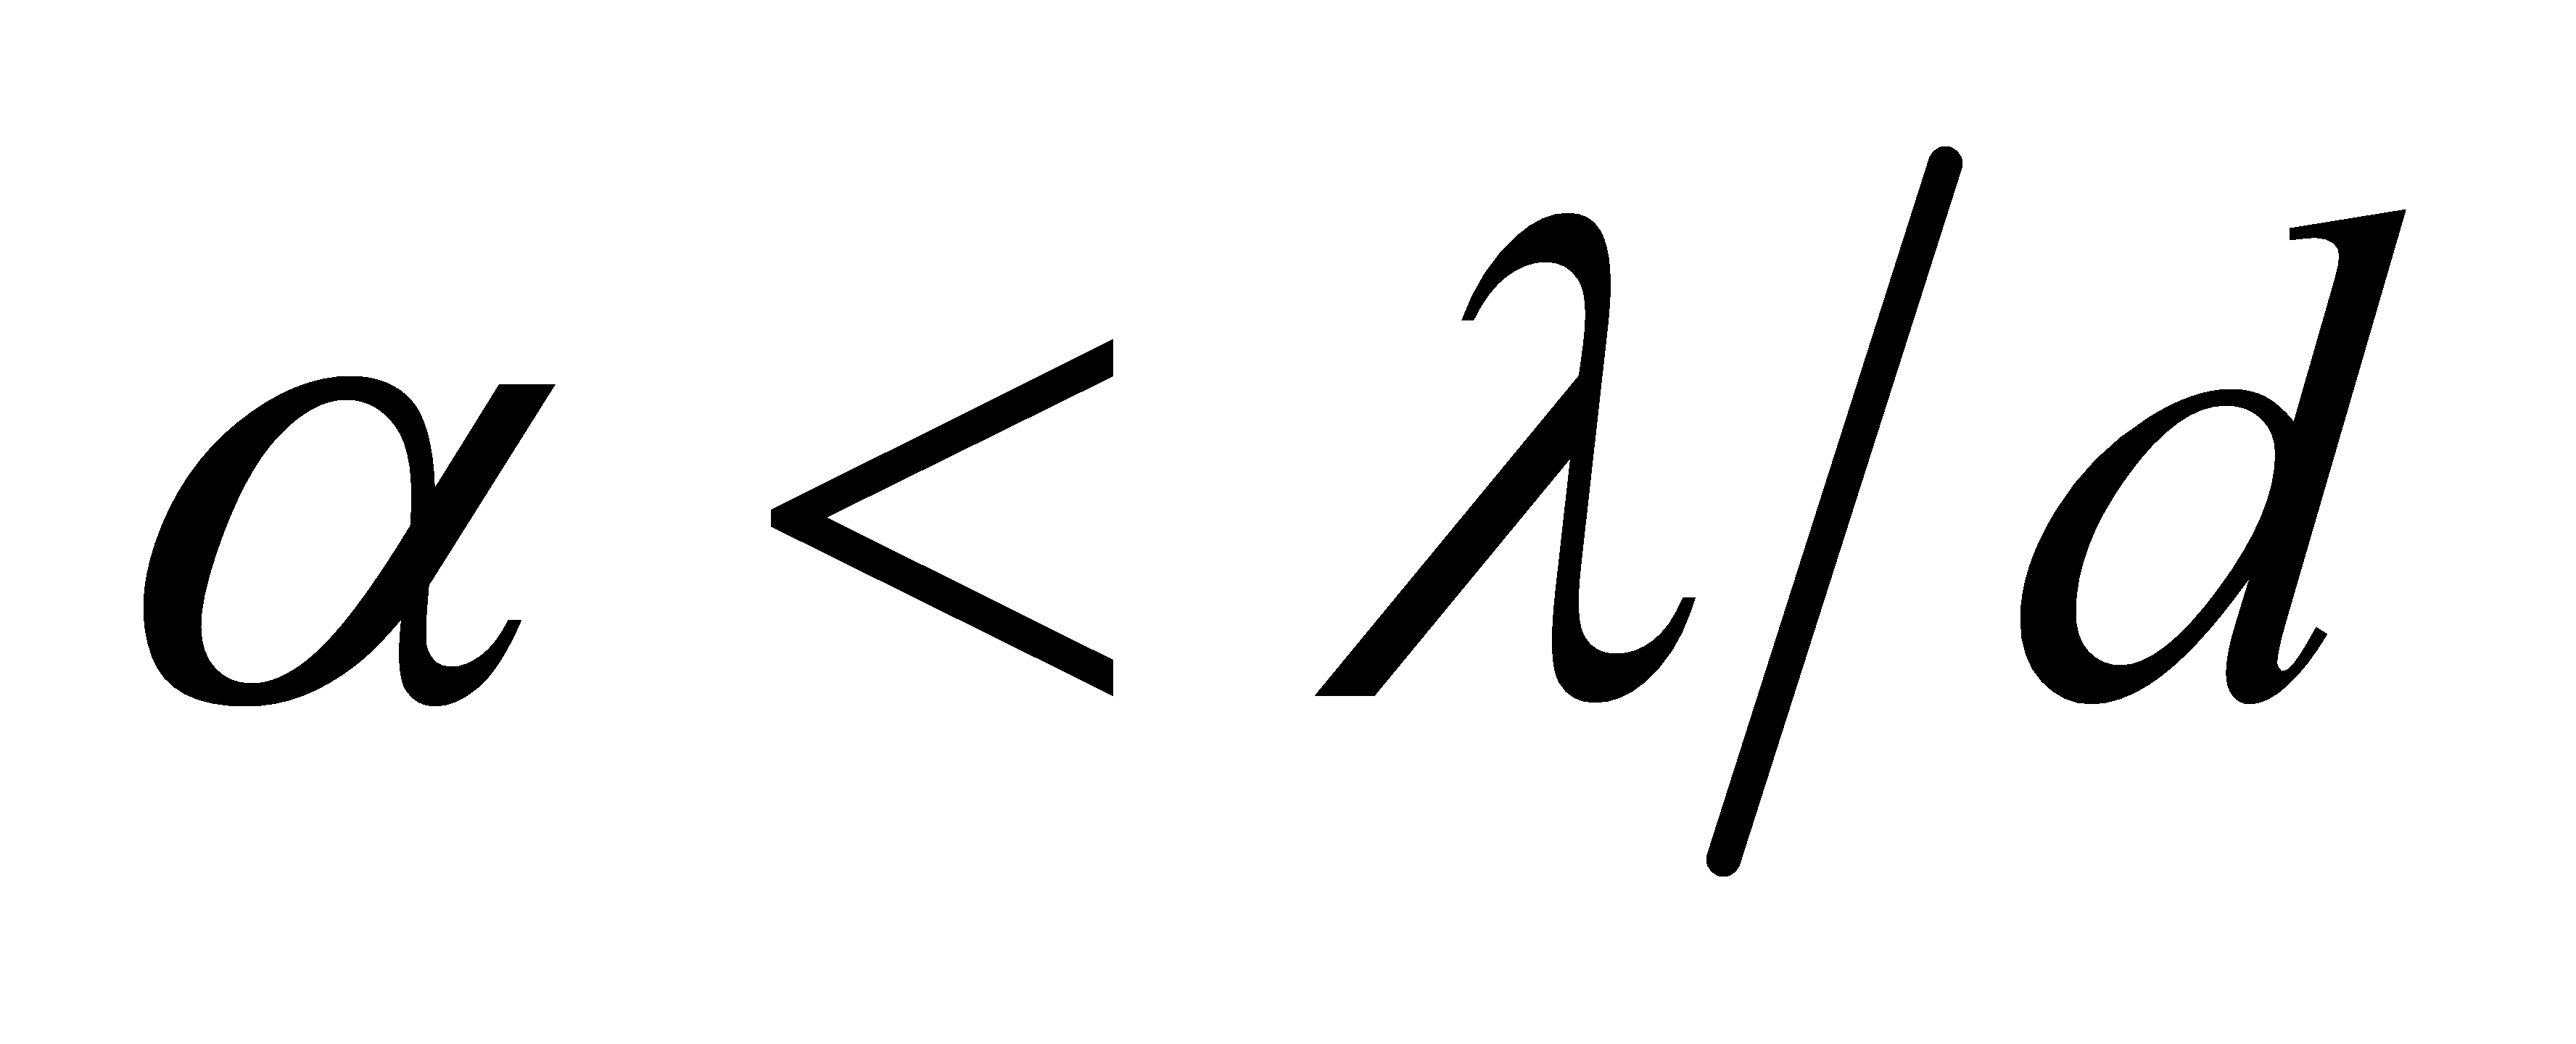 unless the interference pattern is smeared and essentially unclear. The Sun angular dimension is of the order of 0.5 degrees and about five times exceeds the permissible value for the mean wavelength
 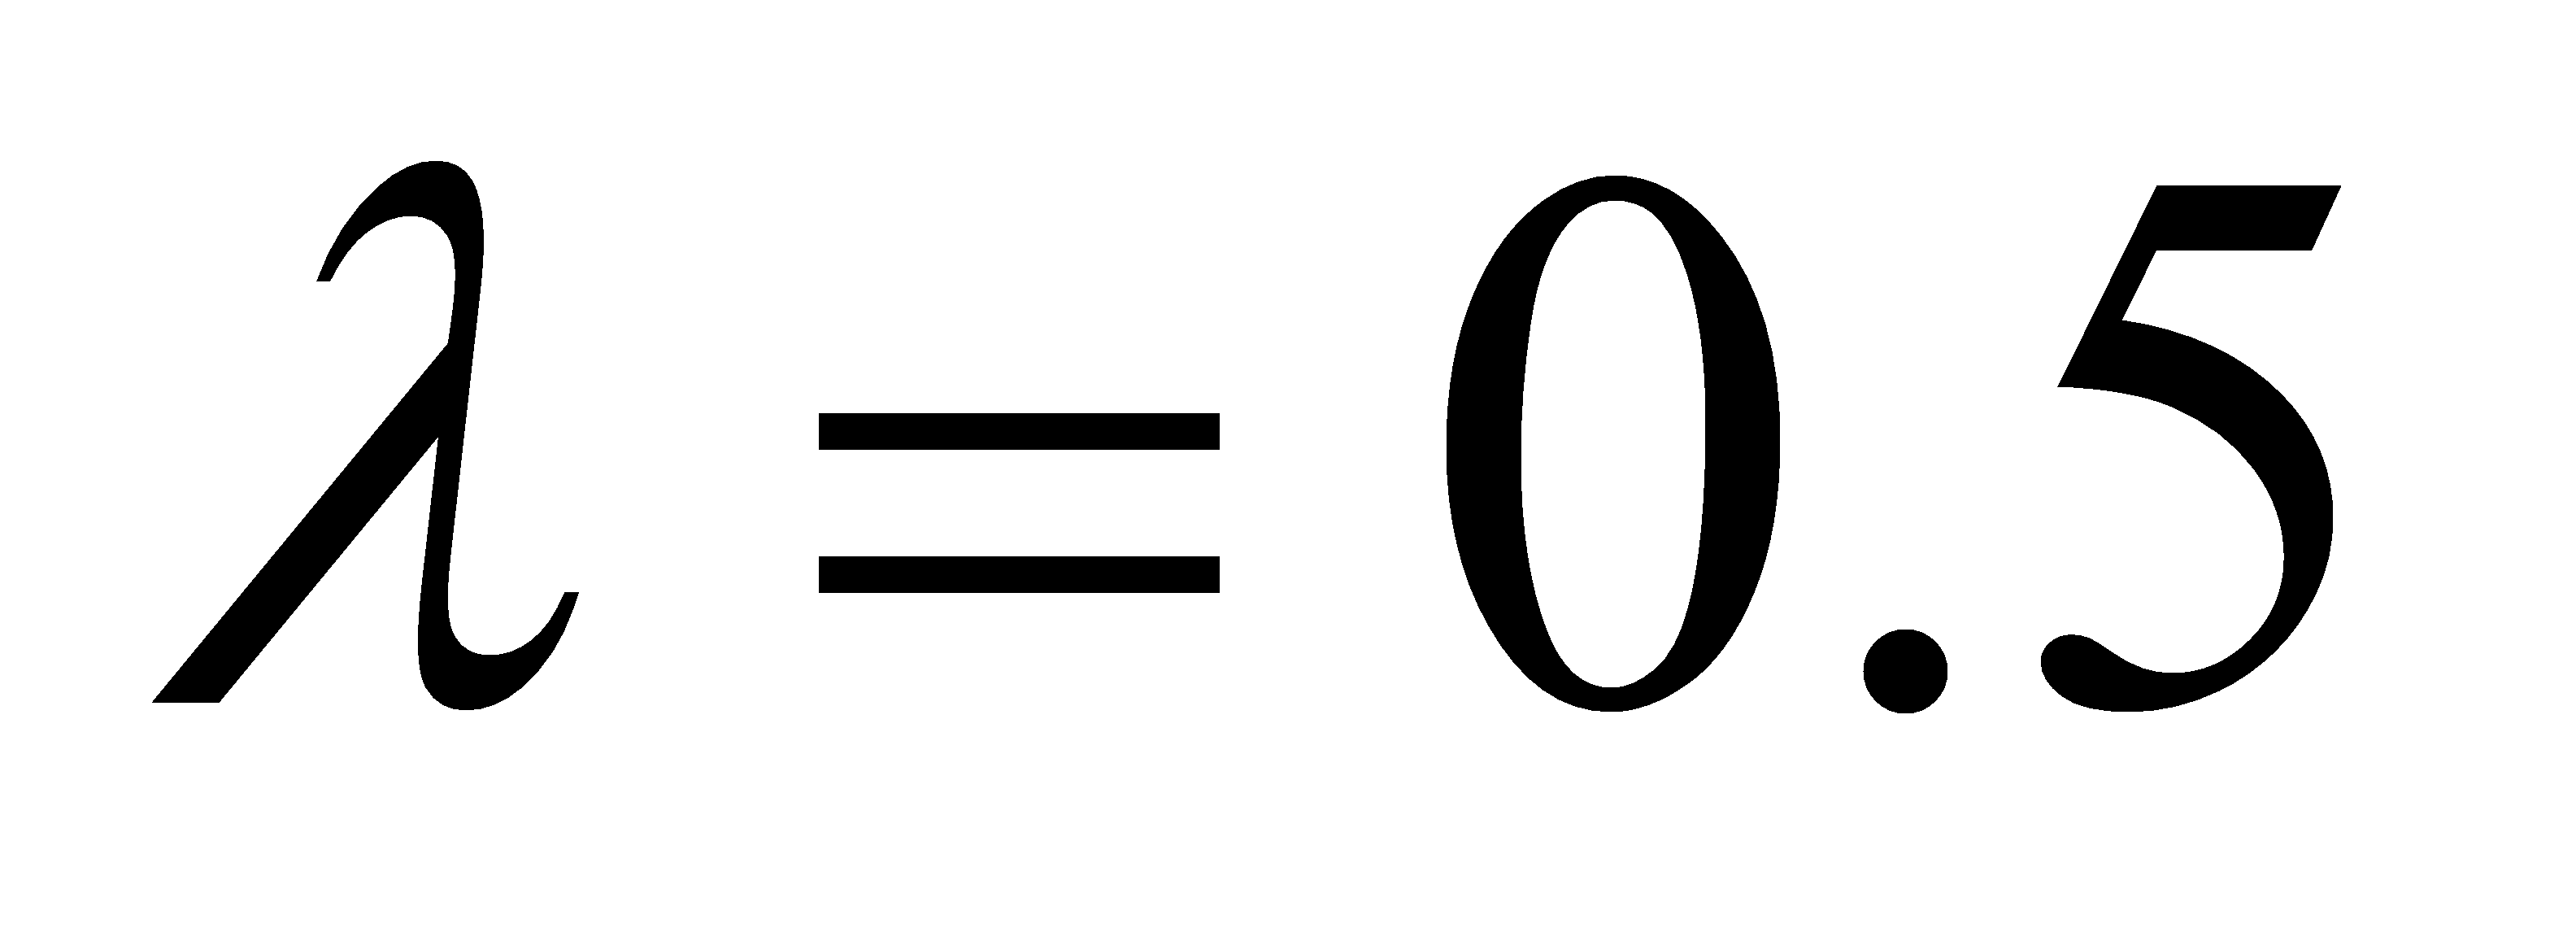 micrometers and a slit separation of
 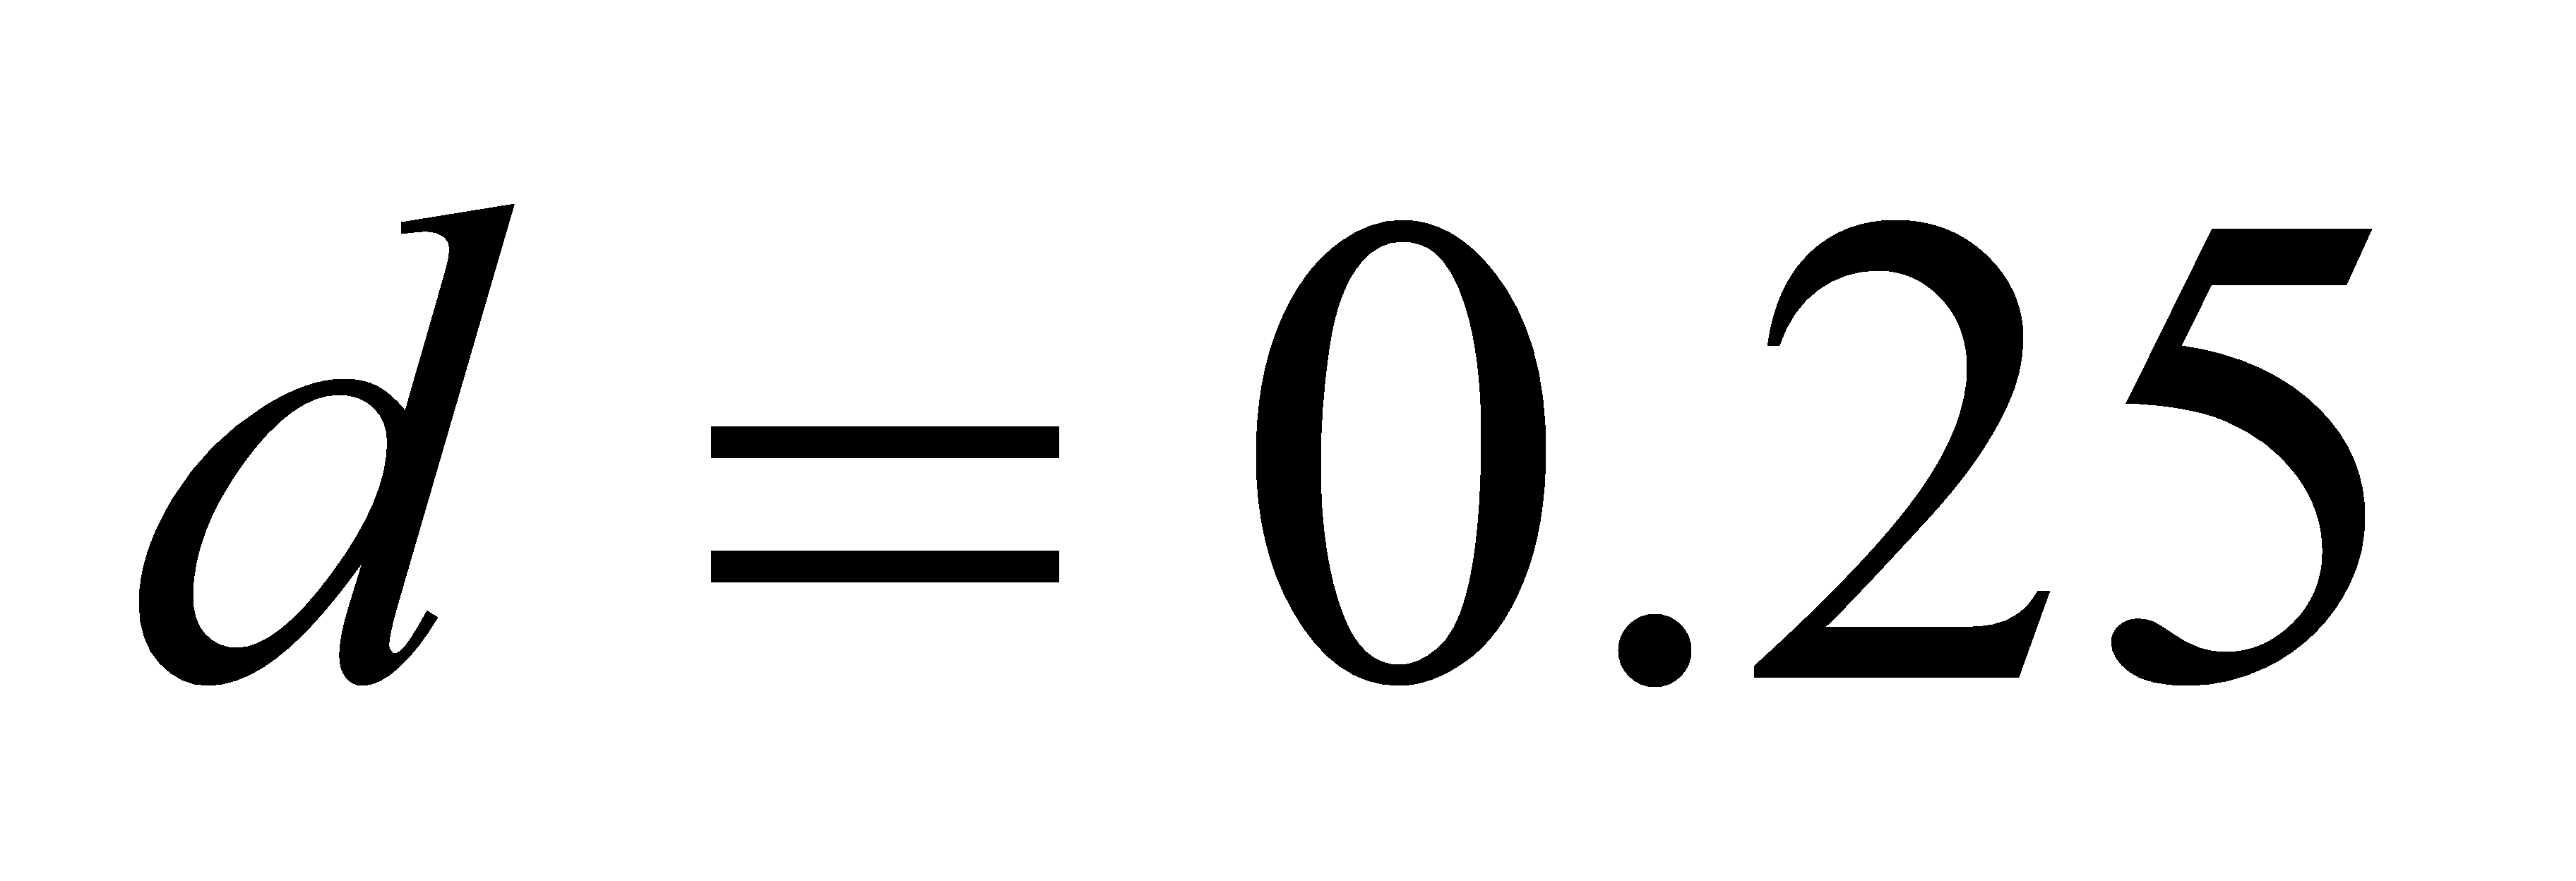 millimeters. ↩